Management Reports
Management Reports provide a flexible statistical reporting engine for analysing hotel performance and key performance indicators (KPIs).
You can combine the statistics most relevant to your operation in a single report, compare results with a previous period, or analyse performance over time by days, weeks, months, or years. Charts can also be added to visualise selected indicators and trends.
Management Reports include more than 130 indicators covering areas such as:
Occupancy
Rooms
Bookings
Nights
Events
Revenue
Payments
Lost business
Direct business
OTA business
Corporate business
An additional 80 indicators provide average values for different periods, bringing the total to more than 200 available indicators. The complete list of indicators, together with their descriptions, is available directly in Clock.
Standard Management Reports
Clock includes four predefined Management Reports that cover common reporting scenarios. They can also serve as a starting point for understanding the possibilities of the statistical engine.
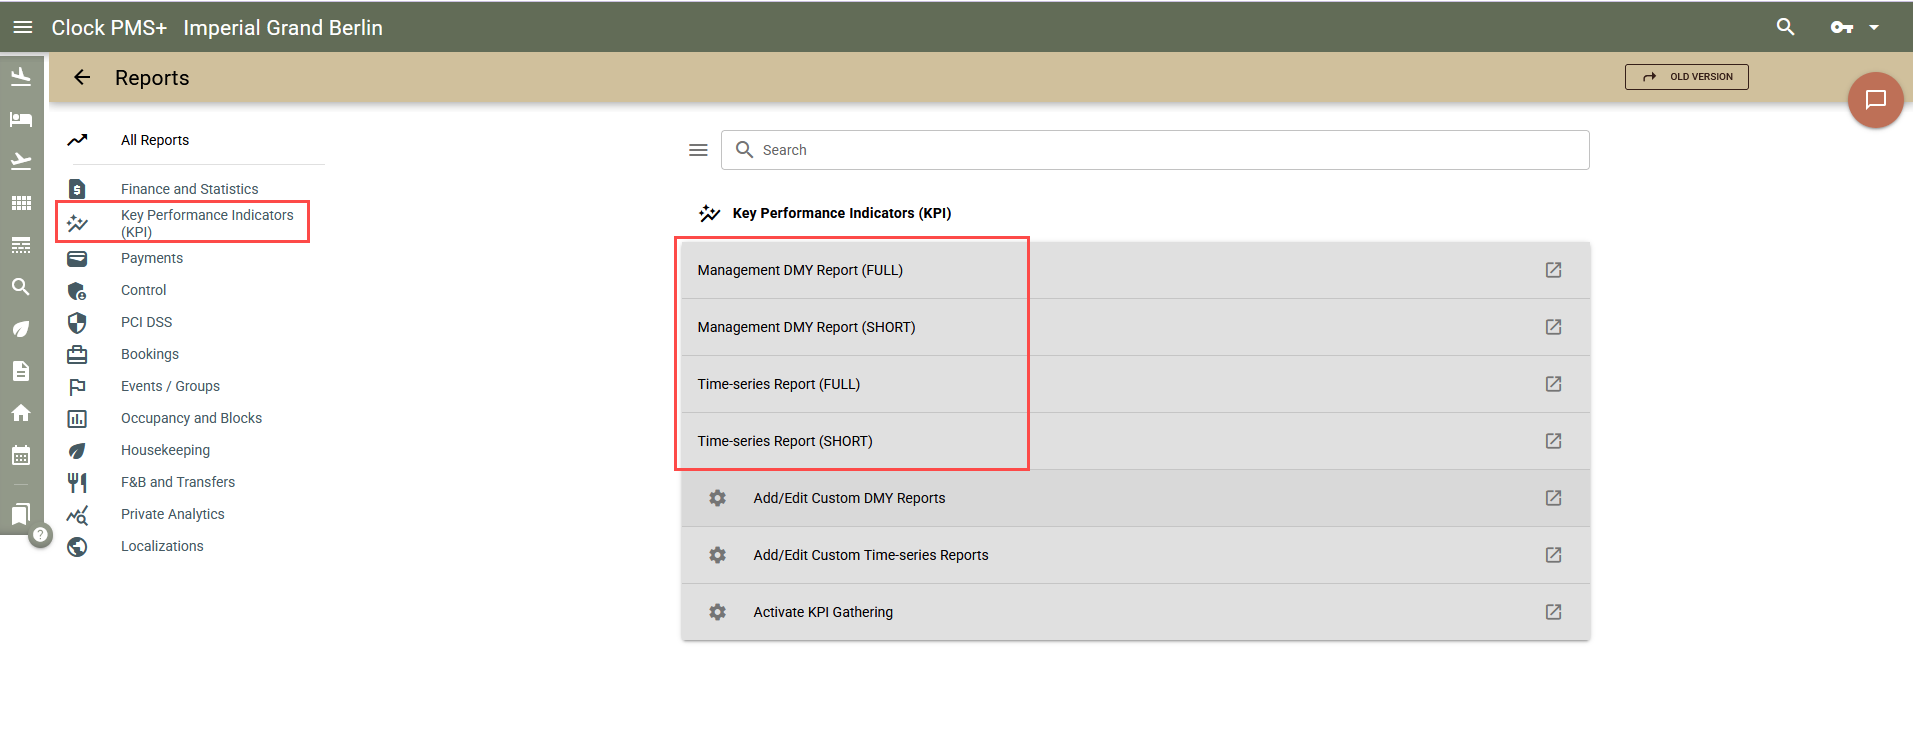
Management DMY Report (FULL)
Displays all available indicators in Day-Month-Year format, together with corresponding comparisons with the previous year.
The report allows you to quickly select the indicators you want to review and provides customisation options similar to Custom Reports. This makes it useful for one-time analyses where creating a separate custom report is unnecessary.
Management DMY Report (SHORT)
Provides the most important management information in a compact format designed to fit on a single page.
It provides a concise overview of key occupancy, revenue, and other performance indicators.
Time-series Report (FULL)
Displays information for a selected period as a time series. Data can be grouped by:
Day
Week
Month
Year
The report can also compare the selected period with the corresponding previous-year period, helping you analyse changes and trends over time.
Time-series Report (SHORT)
Provides a compact daily time-series view containing selected key indicators. The report is designed to fit on a single page in landscape orientation.
Custom Management Reports
Custom Management Reports allow you to determine both what information is displayed and how key indicators are calculated.
In addition to selecting the indicators included in a report, you can configure the calculation of core values such as:
Available rooms
Total revenue
Total event revenue
These settings also affect KPIs calculated from these values, including Occupancy %, RevPAR, TRevPAR, Revenue per Guest, and other ratios.
Because calculation settings are configured per report, you can create different reports that calculate the same indicators in different ways depending on the purpose of the analysis.
Customising Report Content
You can organise and format a Custom Management Report according to your reporting requirements.
- To do so, select 'Add/Edit Custom DMY reports' or 'Add/Edit Custom Time-series Reports' depending on the type of report you want to create.
- Click the '+' button
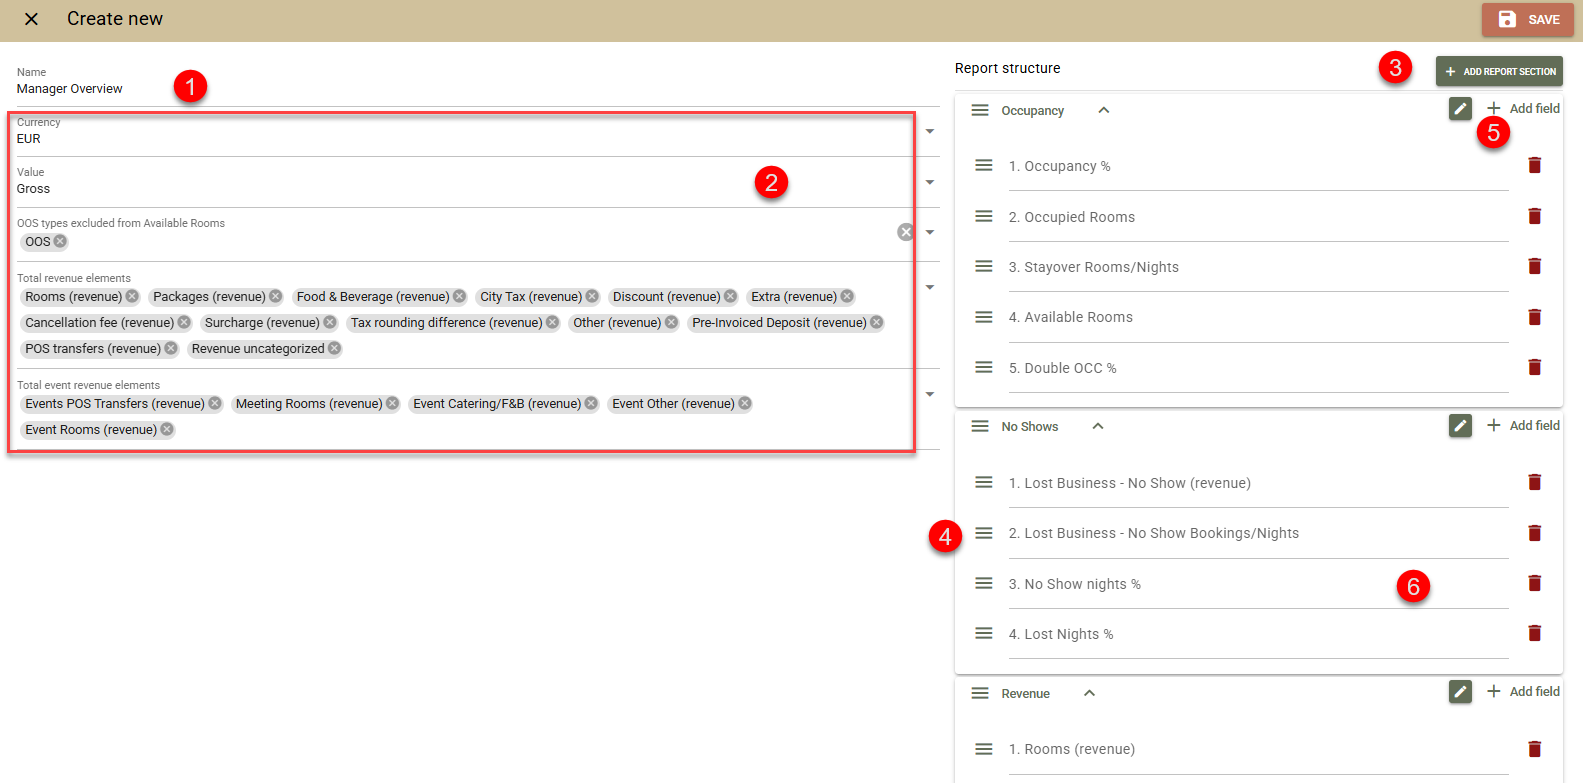
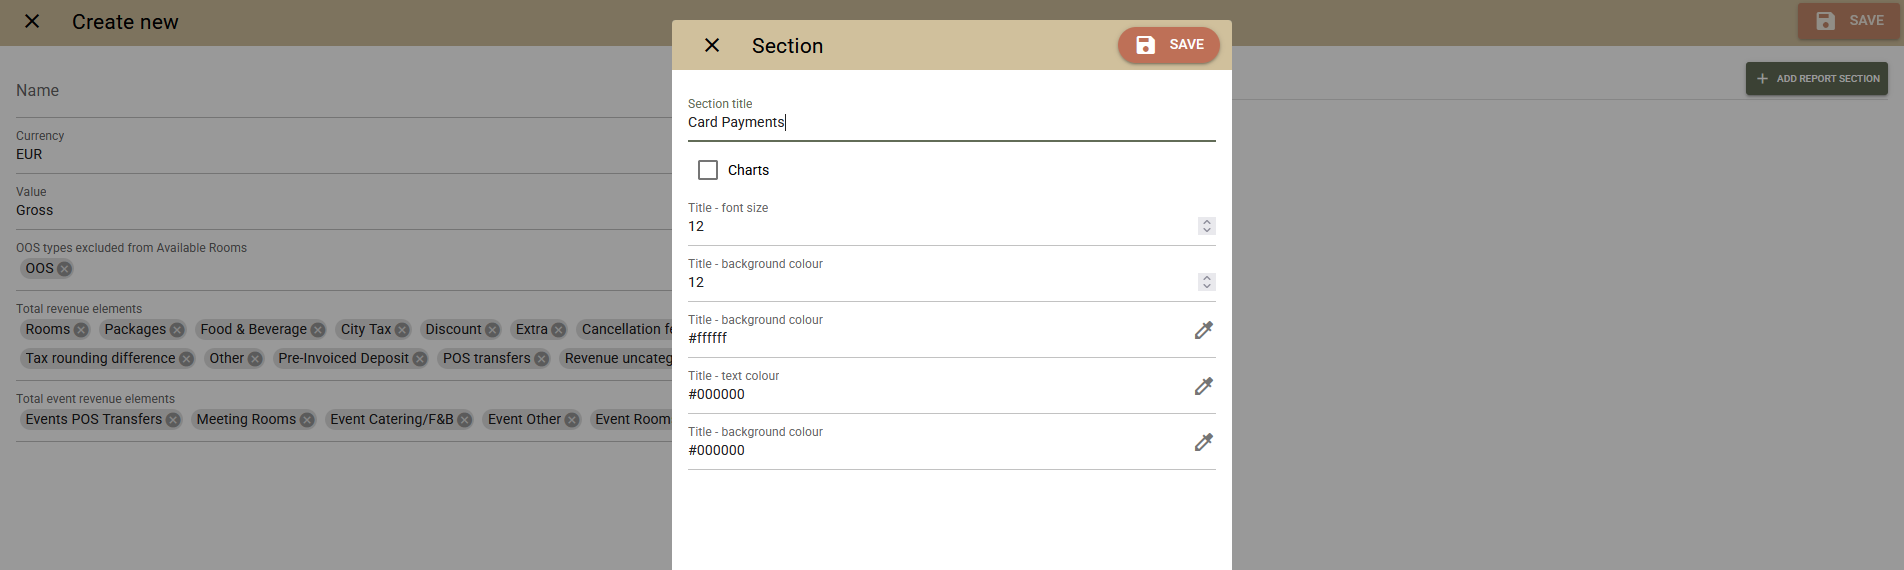
Enter a name for the report (1)
Enter how you would like the Indicator Calculations to be done (2) - see next section.
Click on 'Add report section' (3) - to add a section with information to your report.
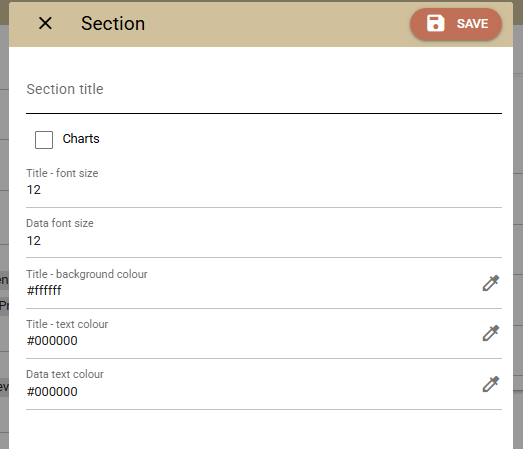
- You can:
- Add a section title
- Select if it should be a Chart
- Adjust font size and colors
- Once you create the section, you will see it listed (4).
- Click on 'Add field' (5) to add parameters to your section
- Using the Drag and Drop option, you can rearange the order of your sections or the parameters within the section.
- You can also change the name of the parameter by clicking on it (6).
Configuring Indicator Calculations
Custom Reports provide several settings that determine how financial and operational indicators are calculated.
Currency
If your property works with multiple currencies, select the currency in which monetary amounts should be displayed.
Gross / Net
Select whether monetary amounts and the KPIs calculated from them should use:
Gross values – tax-inclusive amounts
Net values – tax-exclusive amounts
OOS Types Excluded from Available Rooms
This setting determines how Available rooms is calculated by defining which room-blocking types are deducted from capacity.
You can configure the treatment of OOO, OOS, and House Use blocks.
For example, consider:
- Capacity: 100 rooms
- Bookings: 80 rooms
- OOO: 1 room
- OOS: 2 rooms
- House Use: 3 rooms
- If OOO and OOS are selected for exclusion:
- Available rooms = 100 - 80 - 1 - 2 = 17
- If House Use is also selected:
- Available rooms = 100 - 80 - 1 - 2 - 3 = 14
- The configuration of Available rooms also affects KPIs that use this indicator in their calculations, including Occupancy %, RevPAR, and TRevPAR.
Total Revenue Elements
Select which revenue groups should be included in Total revenue.
For example, this configuration can be used to exclude deposits or POS transfers from the total.
The selected revenue elements also affect indicators calculated from Total revenue, including:
Revenue per Room
Revenue per Guest
Revenue per Adult
TRevPAR
Total Event Revenue Elements
Select which event revenue elements should be included in Total event revenue.
This configuration also affects related indicators, including:
Event Revenue per Day
Event Revenue per PAX
Activating Management Reports
The statistical engine must be activated before Management Reports can be used. To activate it:
Go to Reports -> All Reports.
Open the Key Performance Indicators (KPI) group.
Select Activate KPI Gathering.
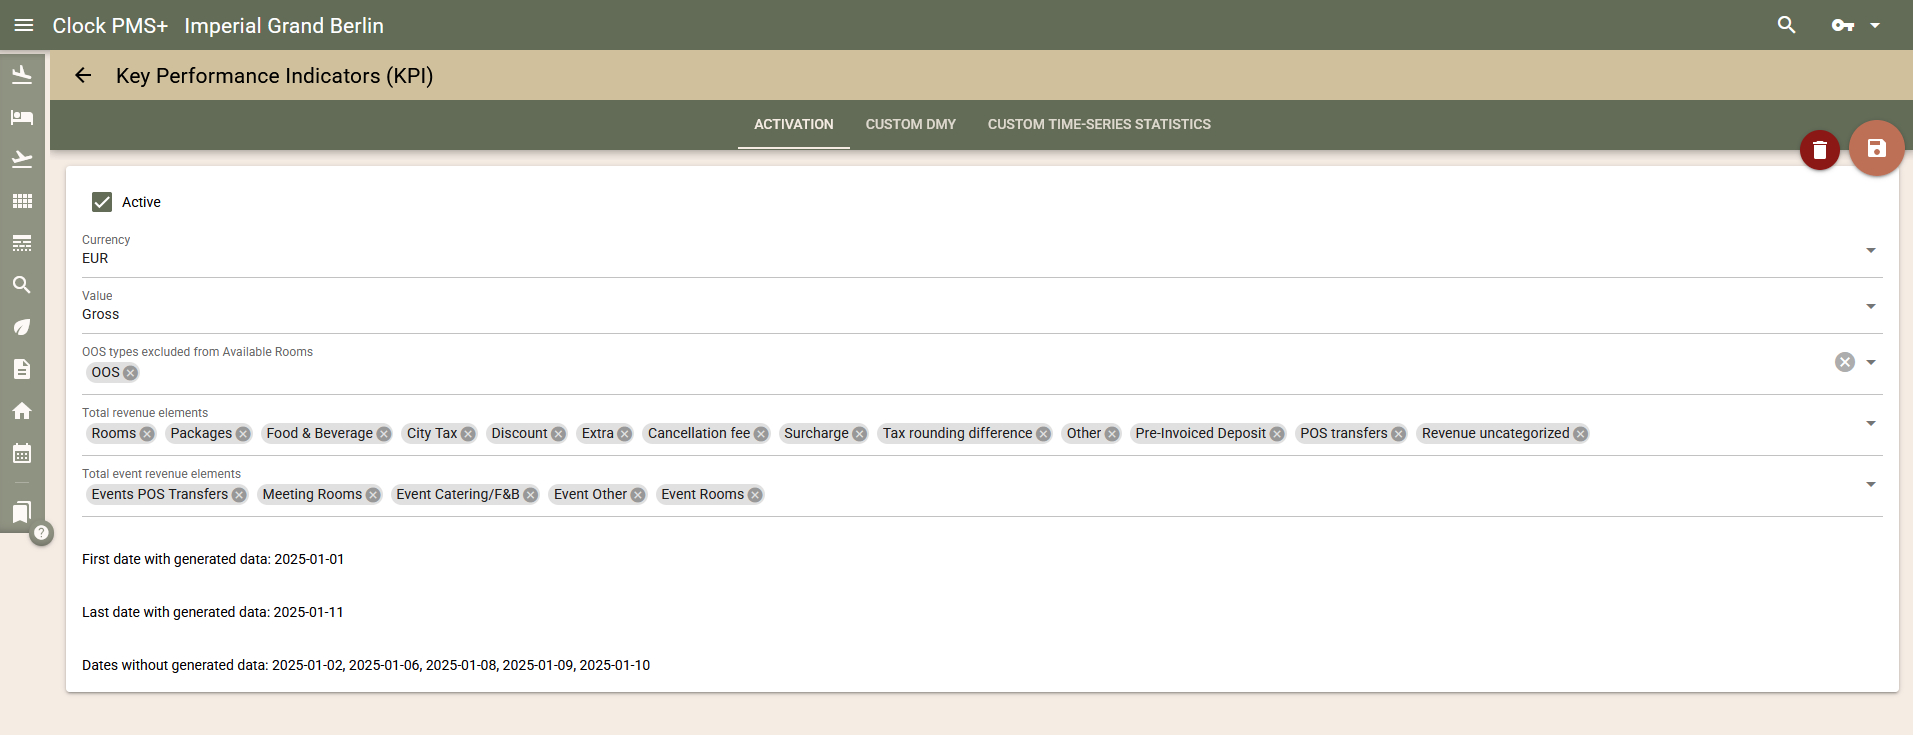
Select the Active checkbox.
Configure Currency, Value, Total revenue, and Total event revenue.
Save the changes.
The values entered during activation are used as defaults when working with reports and creating Custom Reports. They can be changed later if necessary.
After activation, Clock starts generating the statistical data. Historical data is generated from the beginning of the previous year.
You can check the progress by refreshing the activation screen. Data generation is complete when:
Start date with generated data shows the first date of the previous year;
Missing data dates is empty; and
Last date with generated data shows yesterday's date.
Once generation is complete, Management Reports can be used.
How Management Report Data Is Generated
Management Reports use pre-aggregated statistical data rather than processing all detailed booking and charge records whenever a report is opened.
The statistics are generated daily after the financial date is closed. This approach allows reports to efficiently cover long periods and combine many different types of indicators while still producing results quickly.
Data for each date is generated twice.
The first generation takes place after the corresponding night audit. At this point, information related to no-shows and the associated lost business may not yet be final. The data is therefore generated again during the following night audit.
For example:
Data for 1 January is initially generated on 2 January.
The same data is generated again on 3 January.
After the second generation, booking-related changes made retrospectively are not automatically reflected in the aggregated statistics.
To generate the data, deactivate and then reactivate the Management Reports as described above.For example, if a booking is modified more than two days after its departure, the modification will not normally be reflected in booking-related Management Report statistics.
This limitation does not apply in the same way to charges because charges follow their revenue dates and therefore have a strict chronological structure.
If booking information needs to be corrected retrospectively, you can regenerate the statistics for the affected date so that the changes are included in Management Reports.
How to regenerate data for a specific date
Please note that data regeneration is a resource-intensive process and should only be carried out in exceptional circumstances. To regenerate the statistics for a specific date, follow these steps:
Go to Reports → All Reports → Key Performance Indicators (KPI) → Activate KPI Gathering;
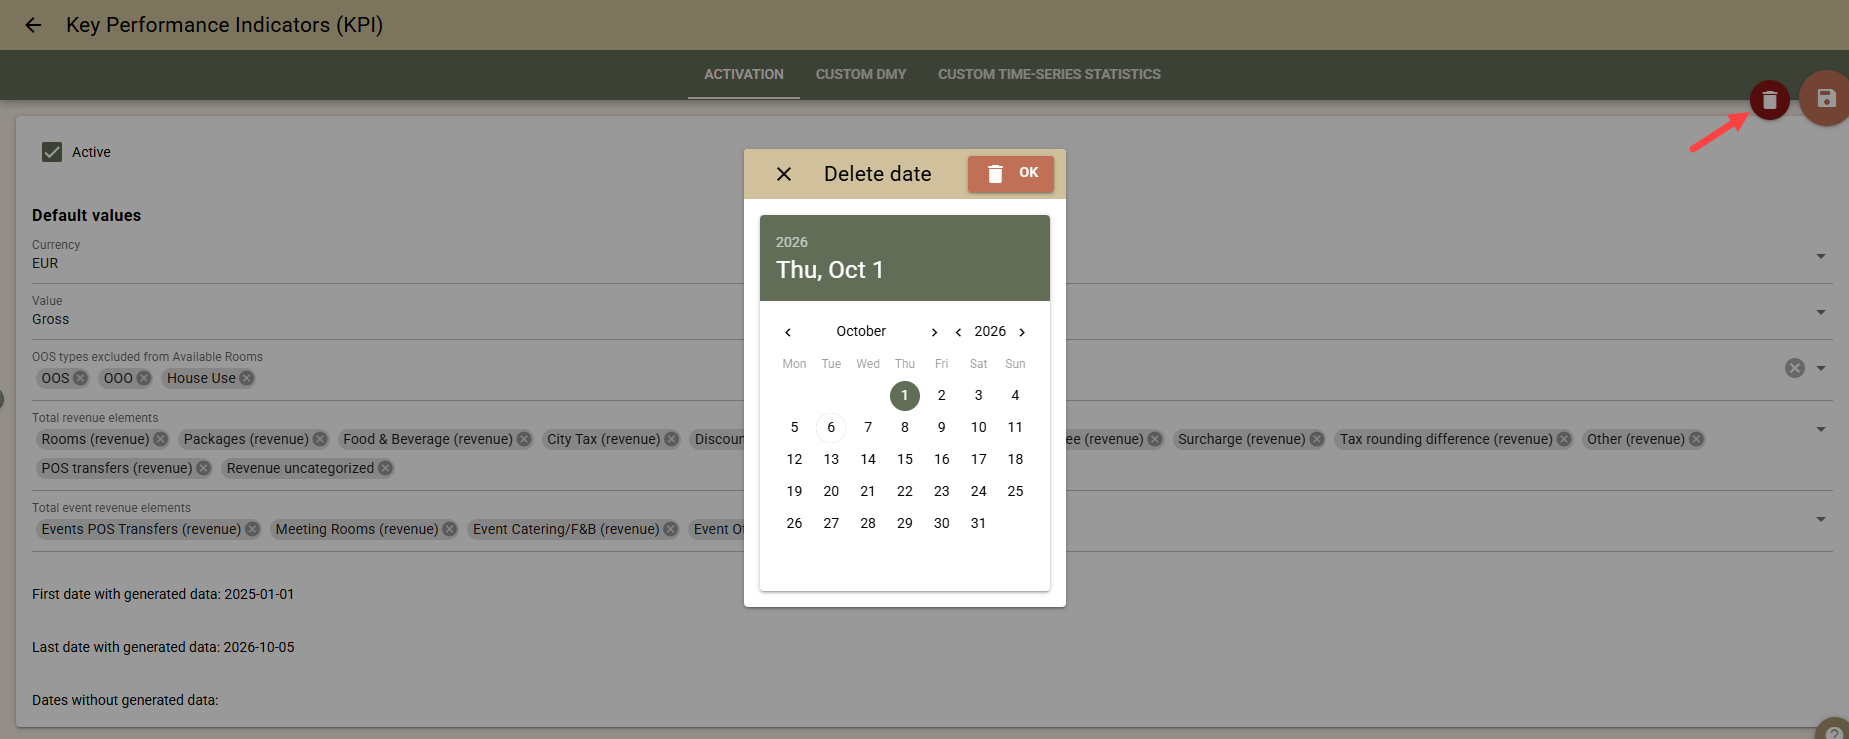
In the top right-hand corner, select the delete button;
Select the activity date for which you wish to restore the data, and confirm the deletion of the current information;
The activity date will appear in the row ‘Dates without generated data’;
To generate the data, deactivate and then reactivate the Management Reports as described above.